
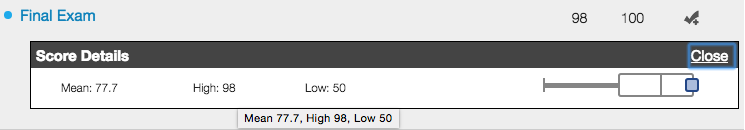
A default setting in Canvas is the student visibility of Grade Distribution Graphs. The distribution graphs show the mean score, the high score, and the low score. Personally identifiable information is never provided to students. However, this type of data may not be useful information for all courses, especially in small classes.
Canvas sets the default global setting for grade distribution for all courses to be Enabled/ON. We cannot turn off the feature at the campus level, but it can be turned off at the course level by an instructor.
When the grade distribution graph is hidden, students can view their scores, but cannot view the mean, high, or low scores.
To hide the graphs contact Educational Technology or follow the steps below:
- Click Settings in the course
- Remain on the “Course Details” tab, scroll down, and click the “more options” link towards the bottom of the settings page.
- Under “more options,” click the box next to “Hide grade distribution graphs from students.”
- Scroll down and click “Update Course Details” to save your changes so the graphs will no longer be visible to students.
More information can be found here: